Robert Duncan Littlejohn | 720.289.3051 | duncanlittlejohnjr@gmail.com
I. November 12th - December 27th
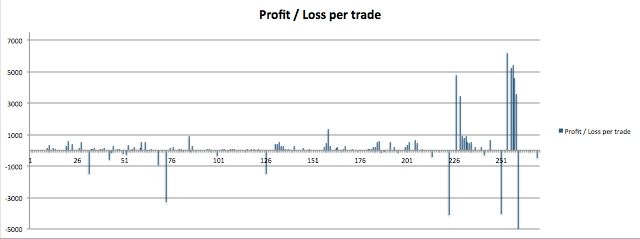
Profits & Loss Per Trade
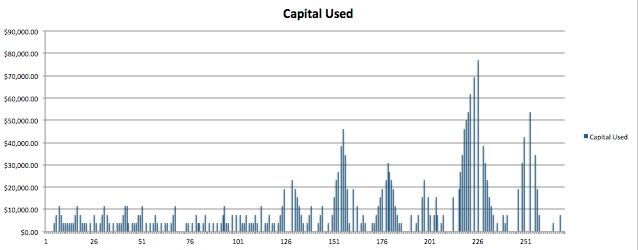
Capital Used
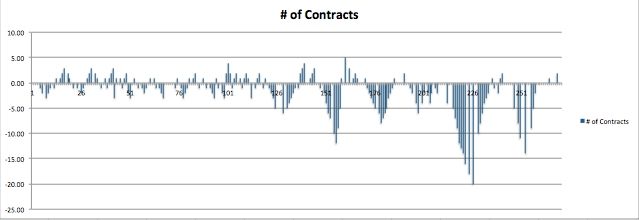
Number of Contracts
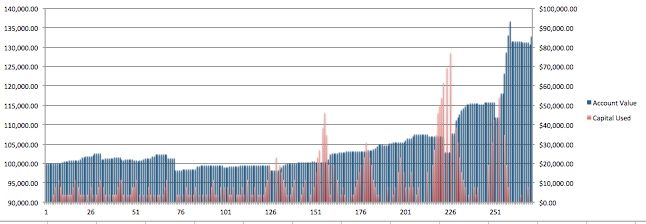
Capital Used Over Total Account Value
Trading Time Frame
Comments
Limited trading capital (3 contracts) is not appropriate for active trading.
At this self imposed level, coupled with a technical software glitch around trade 75 (that resulted in a $3,000.00 loss), I struggled to regain lost ground.
Convinced that an increased capital base would allow me to lower my avg. cost p/ contract, I implemented such a practice when the market moved against me on trade 125.
With such a strategy in place, I have not incurred a significant loss since.
At this self imposed level, coupled with a technical software glitch around trade 75 (that resulted in a $3,000.00 loss), I struggled to regain lost ground.
Convinced that an increased capital base would allow me to lower my avg. cost p/ contract, I implemented such a practice when the market moved against me on trade 125.
With such a strategy in place, I have not incurred a significant loss since.
Loss at trade # 75 was the result of technical software issue.
Trade # 126, 225, 250, & 260 are ALL cash adjustment. No trades were executed.
Most recent loss incurred by trading occurred on Nov. 22nd , in the amount of $12.50.
Trade # 126, 225, 250, & 260 are ALL cash adjustment. No trades were executed.
Most recent loss incurred by trading occurred on Nov. 22nd , in the amount of $12.50.
Most trading was capped at 3 contracts ($11,550.00).
Increased trading capital purposely around trade 125.
Increased trading capital purposely around trade 125.
This chart depicts the behavior of a Bear investor.
Noticeable fluid trends are visible through trades 0 - 30 and 120 - current.
Fluid patters on this chart reflect profitable entering and exiting of the markets.
Noticeable fluid trends are visible through trades 0 - 30 and 120 - current.
Fluid patters on this chart reflect profitable entering and exiting of the markets.
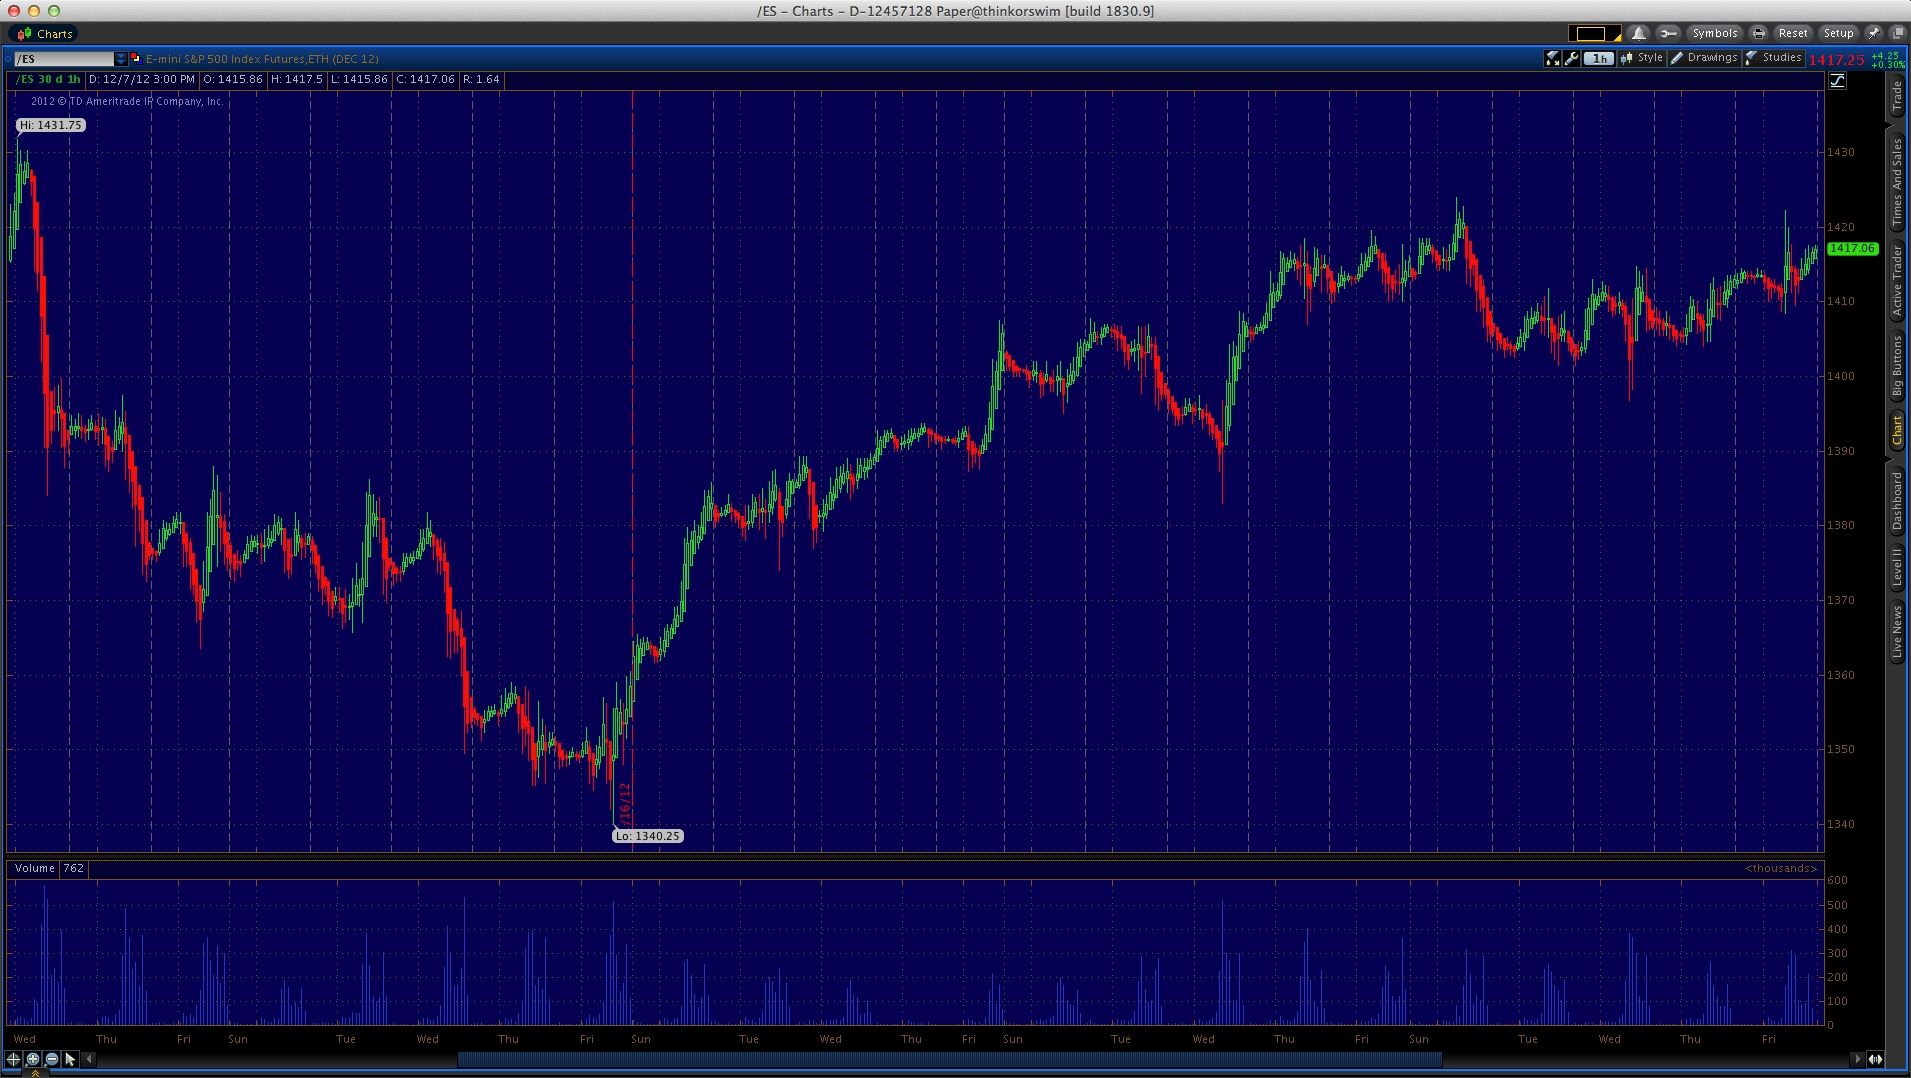
It has not been an easy month for the futures index trader.
While this chart shows some serious price movements, much of it was well anticipated.
The drop in the first third are the direct results of the re-election of President Obama. The second third was simply a correction to a over cautious market, and since then, the daily volatility ranges have diminished significantly.
Action has been concentrated, and highly reactive to ongoing Fiscal cliff arrangements.
While this chart shows some serious price movements, much of it was well anticipated.
The drop in the first third are the direct results of the re-election of President Obama. The second third was simply a correction to a over cautious market, and since then, the daily volatility ranges have diminished significantly.
Action has been concentrated, and highly reactive to ongoing Fiscal cliff arrangements.